

golfcphoto/iStock via Getty Images
The Bristlemoon Global Fund returned 5.0 percent for the September 2025 quarter, with a 5.6 percent return for the month of September 2025, net of fees. For the fifteen-month period since inception, the Fund has produced a cumulative 19.3 percent return, net of fees.
Key performance contributors in the month of September included AppLovin (APP), ASML (ASML), and Alphabet (GOOGL). Notable performance detractors over the same period included PAR Technology Corporation (PAR), Salesforce (CRM), and Hemnet (OTCPK:HMNTY).
In this letter we talk about PAR Technology Corporation, a performance detractor during the quarter, and explain why we still like the stock. We also outline our investment theses for several investments that performed well in the quarter, including ASML, Alphabet and Synopsys (SNPS). But firstly, we would like to provide a recap of our investment approach and the types of stocks we are looking to invest in.
The Bristlemoon Approach
Our mission at Bristlemoon is to compound your capital at attractive rates over the long term. We seek to fulfill this mission by investing in high quality, competitively advantaged businesses with three key traits:
- Possessing attributes that allow us to forecast future earnings and cash flows with a high degree of confidence;
- The ability to reinvest said earnings at high rates of return; and
- Mispriced future earnings power.
|
Unit Price: $1.193
* Excludes derivative positions.
Fund Returns (Net)
|
|||||||||||||||||||||||||||||||||||||||||||||||||||||||||||||
We know exactly the kinds of businesses we want to own. We maintain a list of companies we understand deeply and will only buy when the risk/reward is favourable. We have no qualms in waiting patiently until we get the right price and setup.
Business quality comes in different forms; we try to not be overly prescriptive in how we define quality so as to not unnecessarily close ourselves off to attractive opportunities.
Sometimes quality is obvious. Visa and Microsoft, while not held by the Fund, are good examples – these businesses have clear moats, attractive economics, and few would dispute that these are high quality businesses.
Buying quality businesses that are widely recognised as quality is by no means a bad strategy, but often there’s a business quality premium embedded in the multiple you’re paying to participate in that growth. Paying up for business quality has the unfortunate effect of lowering the future returns available from those stocks. Many of the businesses that are widely perceived as quality are trading at multiples that are too rich to get us excited. In other words, we struggle to get comfort around the level of growth needed to earn an adequate return from those types of investments. If the numbers don’t stack up, we pass on the investment.
Other times quality is underappreciated – that is, quality companies that are misunderstood or out of favour. For these businesses, the element of quality is in dispute. This could be due to a messy story, business complexity, or an erroneous narrative that has kept investors away (e.g., Fair Isaac Corporation). Or it could be an okay business that is becoming a great business – that is, a company whose quality has improved in recent years, with a moat that is quietly expanding in a way that has not yet been recognised by the market (AppLovin would be an example of this over the past two years).
Investing in underappreciated quality usually feels less comfortable than putting capital into businesses that are widely perceived as quality, but the contention inherent in these opportunities can serve as the fuel for outsized investment gains. The beauty of underappreciated quality is that you don’t just benefit from the earnings compounding, but you can also get the added kicker of the multiple re-rating as the market eventually recognises the business’s true quality.
Often, these situations that we’d deem underappreciated quality are fertile ground for doing deep work to build differentiated insights. Said another way, the potential to have an edge in these out-of-favour opportunities is arguably higher.
We aim to construct a portfolio comprised of stocks with the best risk-adjusted returns, traversing opportunities in both the obvious and underappreciated quality buckets. In every case, we stay disciplined in paying a sensible price, making sure that every opportunity meets our return thresholds.
A less prescriptive definition of quality allows us to pivot to where the opportunities are. We’re not interested in investing only in “X type of business model”. There are times when those types of businesses outperform, and times when they don’t. Rather, we just aim to generate alpha when the opportunity presents itself. We have intentionally kept our mandate broad so we can pursue the opportunities with the most attractive risk/reward.
Much of this decision to keep a more flexible investment mandate stems from the fact that Daniel and I have substantially all our liquid net worth invested in the Fund alongside your own investment. Our incentives are fully aligned with yours, and we hope to produce attractive investment returns for years to come and compound our capital together.
We are deeply grateful for your continued support as an investor in the Fund and hope to serve you well in the future as a steward of your capital. For the remainder of this letter, we discuss some of the stocks held in the Fund to provide a better sense of the types of stocks we are invested in.
Firstly, we cover some recent additions to the Fund where consensus bearish narratives created attractive entry points for what we deem to be high quality, enduring businesses: ASML, Alphabet Inc, and Synopsys. We wrap up with a discussion of our biggest underperformer in the quarter – PAR Technology Corporation – and explain why the focus on the short-term is causing investors to miss the potential for solid long-term value creation.
ASML Holding N.V.
ASML is a Dutch company that develops, assembles and sells photolithography (“litho” or “lithography”) machines that are used to print integrated circuit designs onto silicon wafers during the semiconductor fabrication process. ASML is the sole supplier of Extreme Ultraviolet (EUV) lithography machines that are used by the likes of TSMC (TSM) and Intel (INTC) to fabricate the most advanced chips for AI, smartphones and computing. It also has an effective monopoly over Deep Ultraviolet (DUV) machines which are the primary litho workhorses within a fab.
There is plenty of material in the public domain explaining why ASML is a one-of-a-kind business, so we won’t belabour the point here. Instead, we want to focus on why the opportunity to buy this business at a steep discount existed in the first place considering the AI investment boom taking place, and where our views diverged from the market.
Since attaining an all-time high of €1,002 in mid-2024, ASML subsequently experienced a -45% drawdown at the Liberation Day trough and has otherwise trodden water in the ~€700 range. A disastrous Q2 2025 earnings call where CEO Christophe Fouquet volunteered that ASML “cannot confirm” growth in 2026 despite no one asking him about 2026 further amped up the bearish narrative to eleven.
The main arguments for not owning the only monopoly in the semiconductor industry during an AI infrastructure frenzy can be summarised as follows:
- 2025 orders and 2026 sales of DUV will be weak because of China demand normalisation.
- 2025 orders and 2026 sales of EUV will be weak because the 2nm Gate-All-Around (GAA) transistor architecture transition means no additional EUV layers compared to 3nm – that is, we have reached “peak lithography” as a share of wafer fab equipment (WFE) capex.
- ASML will be selling to a monopsony (TSMC) given the struggles at other key customers Intel and Samsung (OTCPK:SSNLF).
- China will develop homegrown DUV and EUV tools and ASML will lose the China market.
In our opinion, the bear theses largely miss the forest for the trees. In principle, we believe several statements to be true:
- The level of global wafer demand determines the demand for semicap equipment, regardless of production location;
- ASML is a monopoly and anyone who wants a DUV or EUV tool must order from ASML (though Canon and Nikon also sell a negligible volume of inferior DUV tools);
- Accordingly, a customer that doesn’t place an order with ASML this quarter must eventually place an order if they want to produce any wafers from their fab.
Now we address each of the bear arguments in turn.
2025 orders and 2026 sales
ASML orders are lumpy. This is to be expected when EUV machines cost over $200 million each, have 12+ month lead times and there are only a handful (5-6) customers. Management consistently reminds the market to not read into quarterly orders as a reflection of the underlying health of the business, but the market consistently ignores this and fixates on near-term orders.
Regarding China DUV demand, sales to China reached as high as 49% of net system sales in H1 2024 and has fallen to 27% as of Q2 2025. Management expects China sales to normalise to 25% of total, in-line with the backlog mix. It is a valid concern that China may have been stockpiling (i.e., overordering) DUV tools over the past two years in response to US export restrictions, but the country is also in a hurry to build out sufficient semiconductor production capacity to meet domestic needs. Chinese foundries (namely SMIC) are also trying to achieve 7nm and even 5nm mass production without EUV, which necessitates multi-patterning using DUV tools at very poor yields. With pressure to ramp up volume production of domestic GPUs, we do not see Chinese demand for DUV tools falling away absent further export restrictions from the Dutch government.
As for the “peak lithography” fear, 2nm GAA is a transistor architecture change (the prior one was FinFET in the early 2010s) rather than the typical litho-driven node shrink. This is an etch- and deposition-led transition, and once the industry progresses beyond 2nm into the Angstrom era, we expect litho shrink to be the main driver of node progress once again.
Source: Company data, UBS estimates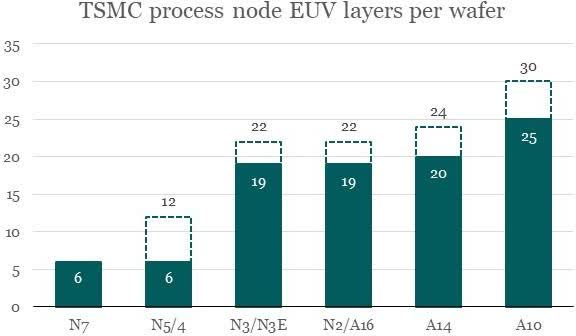
Customer struggles and monopsony concerns
Being a monopoly is all well and good, until your customers drop away and you’re left selling into a monopsony customer. This is the main concern when it comes to ASML’s relationship with TSMC, given the struggles that Intel and Samsung have faced at the leading edge. We believe this concern is overblown for several reasons.
Firstly, ASML and TSMC have a symbiotic relationship – they depend on each other for success. TSMC may have the industry’s most efficient EUV lithography processes, but efficiency can only go so far to offset the need for additional wafer capacity. The company has repeatedly said that the N2 family will be its biggest process node yet with more tape-outs than N3 or N5, so we have no concerns that a lot of EUV tools will be required. Furthermore, TSMC’s buildout of leading edge capacity in the US will be less efficient than its operations in Taiwan given the limited opportunity to reuse lithography tools from node to node.
Secondly, we need to recognise that while TSMC is ASML’s largest customer (historically in the 30% range of total revenues), it is by no means the only EUV customer. Challenges at Intel and Samsung foundry have been offset by EUV insertion at the leading nodes by the DRAM vendors. The insatiable demand for high bandwidth memory (HBM), which has a wafer trade ratio of 3- or even 4-to-1 (that is, it takes 4x as many wafers to produce the same number of HBM bits as it does for DRAM), plus the demand for traditional DRAM by emergent agentic AI systems, should provide a healthy tailwind for EUV demand from the DRAM industry.
|
EUV unit shipments |
2015 |
2016 |
2017 |
2018 |
2019 |
2020 |
2021 |
2022 |
2023 |
2024 |
2025 |
|
Low-NA |
|||||||||||
|
TSMC |
1 |
1 |
3 |
10 |
15 |
15 |
20 |
22 |
19 |
13 |
20 |
|
Samsung Foundry |
1 |
1 |
1 |
2 |
4 |
9 |
11 |
14 |
4 |
2 |
2 |
|
Intel |
2 |
2 |
2 |
3 |
3 |
2 |
2 |
9 |
7 |
8 |
3 |
|
Samsung Memory |
– |
1 |
– |
1 |
1 |
4 |
7 |
5 |
6 |
6 |
5 |
|
SK Hynix |
– |
– |
– |
1 |
1 |
1 |
1 |
3 |
4 |
10 |
8 |
|
Micron |
– |
1 |
– |
1 |
– |
– |
1 |
1 |
2 |
2 |
2 |
|
Others |
– |
– |
1 |
1 |
2 |
– |
1 |
– |
– |
1 |
2 |
|
Total |
4 |
6 |
7 |
19 |
26 |
31 |
43 |
54 |
42 |
42 |
42 |
|
High-NA |
|||||||||||
|
TSMC |
1 |
2 |
|||||||||
|
Samsung |
1 |
||||||||||
|
Intel |
1 |
2 |
2 |
||||||||
|
SK Hynix |
1 |
||||||||||
|
Micron |
|||||||||||
|
Others |
1 |
||||||||||
|
Total |
1 |
4 |
6 |
Source: Company data, UBS estimates
OpenAI’s (OPENAI) recently announced partnerships with Samsung and SK Hynix to procure 900,000 DRAM wafer starts per month “at an accelerated capacity rollout” represent a doubling (!!) of the two companies’ existing capacity in 2024. While we ascribe very little weight to Sam Altman’s grandiose dealmaking, particularly when it comes to OpenAI’s ability to pay, the scale of such partnerships highlight just how much of a bottleneck memory capacity is to the AI industry’s ambitions.
Finally, the uncertainty surrounding the viability of the Intel and Samsung foundries has subsided somewhat with the recent US government and Nvidia (NVDA) investments in Intel, and Samsung’s $16.5 billion multiyear deal to manufacture the AI6 chip for Tesla on its 2nm process. When it comes to Intel in particular, we believe the US government requires an American leading edge foundry operating in the US for national security purposes. It is also in the interest of all TSMC’s leading edge customers to have an active insurance policy in the US should TSMC’s Taiwan fabs and R&D centres go offline for whatever reason.
China domestic competition
China has committed tens of billions of state funds in pursuit of semiconductor self-sufficiency, from fabrication to wafer fab equipment (WFE). This push has taken on additional urgency since the initial WFE export restrictions from 2022. Given the size and growth of the China WFE market – from c.20% of global WFE demand in 2018 to mid-30% expected over the next several years, China’s self-sufficiency drive is a concern for all Western semicap equipment vendors. Bernstein estimates that in 2024, China had achieved over 20% self-sufficiency in the major segments of etch and deposition and nearly 40% in less technically demanding process steps such as cleaning.
However, the only process step where China remains at zero self-sufficiency is lithography. China’s lithography champion, Shanghai Micro Electronics Equipment (SMEE), completed development of an ArF immersion tool capable of 28nm process steps in December 2023. As far as we can tell, that tool is not yet commercialised. ASML first introduced an ArF immersion tool in 2003, putting SMEE (and China broadly) two decades behind ASML. Even if China continues to accelerate its domestic development, industry experts generally believe that a competitive homegrown DUV tool is years away and EUV more than a decade away. In any case, ASML has never been permitted to sell its EUV tools to China, and we find it hard to believe that non-Chinese fabs would elect to buy a likely inferior Chinese lithography tool, geopolitical considerations aside.
Source: Bernstein estimates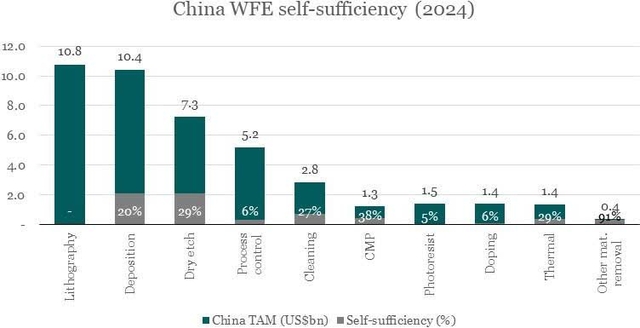
Ultimately, our decision to establish a position in ASML at the time we did came down to risk/reward and duration. We saw limited downside risk at a sub-25x one-year forward P/E ratio, and significant upside once the market looked beyond the H2 2025 orders and 2026 sales uncertainty. The feedback we received from the sellside – as recently as mid-September – was that buyers were waiting to clear the Q3/Q4 order overhang before stepping in. While we are under no illusion as to our skill at timing the bottom, we also know that Mr. Market doesn’t ring a bell when the bottom is in. There is absolutely a risk that ASML sells off again on weak near-term orders, but our advantage lies in having the duration that many in the market seemingly do not.
Alphabet Inc
Alphabet (GOOGL) is another stock that we felt had been undeservedly beaten down by a bearish narrative that largely ignored the fundamentals of the business. We began accumulating GOOGL in June and continued adding to our position in Q3 as we waited for the market narrative to flip on its head. Alphabet needs no introduction, so we will jump straight into why we thought the AI disruption and terminal value fears were overblown.
Google failing to innovate?
The notion that Google has lost the ability to innovate is a common refrain that we have heard over the past several years – essentially since the November 2022 ChatGPT moment – and one that we subscribed to ourselves at one stage. The genesis of this complaint is easy to understand:
- Despite (or perhaps because of) being a tremendous monetary success, the Google Search experience has been degrading for years as sponsored links, shopping ads, algorithm changes and rampant SEO abuse made it increasingly tedious for users to find answers to their queries.
- Google has nine services with over 1 billion users each, yet these are all over one or two decades old, and the company has failed to launch a new service or product with massive adoption in recent years despite its distribution advantages. At least Mark Zuckerberg has the distinction of copying well.
- More pressingly, Google has lost the ability to productise its innovations. Google was the foremost AI research organisation and published the seminal paper on transformers in 2017, and yet it was OpenAI that delivered the first AI product that captured the consumer zeitgeist five years later. The Bard AI demo at Google I/O 2023 will go down in history as one of the biggest live demo flops, and even when it did ship something that worked, Google had an uncanny knack for undermining itself with subsequent blunders.
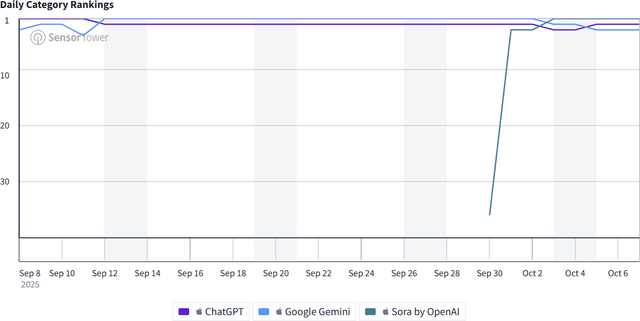
This was the prevailing sentiment throughout 2023 and 2024, and while the share price staged a strong recovery out of the 2022 bear market trough, the path was volatile and largely not due to Google being perceived as an AI winner. Google was, in the words of Stratechery’s Ben Thompson, an “amorphous blob” with an indiscernible strategy – the company was so accustomed to winning by default that it took a long time and several embarrassing stumbles to get its competitive gears turning. But once it got going, Google has shipped market-leading product after product, including the Gemini 2.5 family of models, Veo3, AI Mode and most recently, Nano Banana, which pushed the Gemini app to #1 in the App Store. This is in stark contrast to Meta, which has spent a not-dissimilar quantum of AI capex and failed to produce a frontier model or usable consumer AI product.
Source: Polymarket. Based on LMArena leaderboard Source: Sensor Tower, US iPhone top overall apps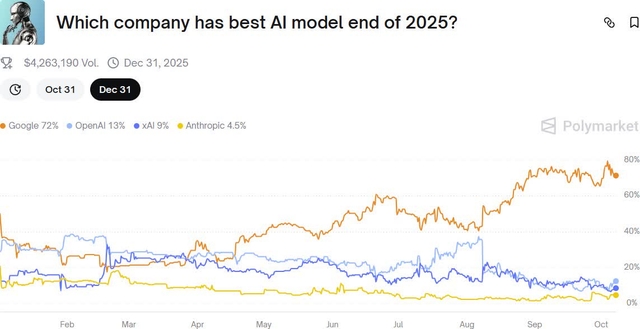
Will Google Search be disrupted by AI?
We find it interesting that once Google started seriously competing at the AI frontier, the emergence of reasoning models, deep research, computer use and agentic search capabilities caused the Google Search disruption narrative to boil over. We believe this, combined with the early 2025 momentum unwind and Liberation Day crash, is what caused Alphabet’s forward P/E multiple to plumb the 2022 lows.
For starters, we would point out that any anecdotes about Google Search losing share or being disrupted by AI-driven search, are simply not borne out by the data. In May, Apple’s Eddy Cue disclosed during Google’s Search remedy trial that Google searches in Safari declined in April for the first time ever, sending the stock down -9%. Google retorted that overall query growth in Search was growing, including on Apple’s devices and platforms. The implication here is that Safari itself may be losing share of search on iOS to Google’s own Chrome and Google apps.
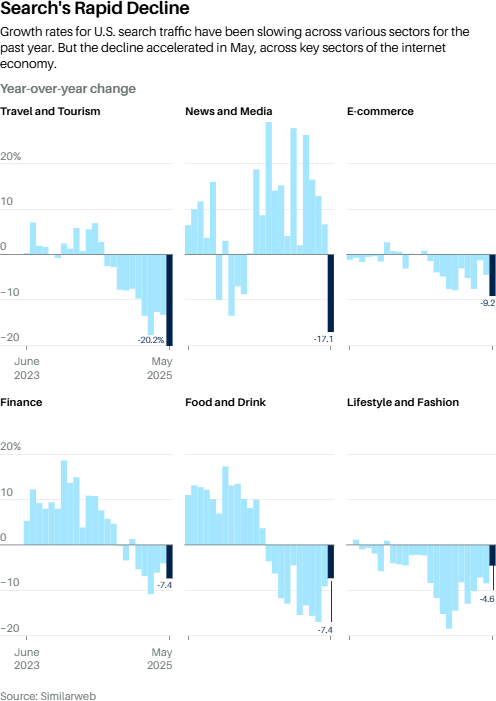
At the same time, the charts below fuelled the debate that AI chatbots were rapidly taking share from Google Search and that search was in decline. However, we note that the data being presented is Internet traffic sent from search engines (predominantly Google Search), rather than keyword searches for these verticals. The most straightforward explanation is that since the introduction of AI Overviews, Google has been able to answer an increasing number of queries without users needing to click links on the results page.
Google’s reported financial performance also shows no evidence of a decline in the search business, with relatively stable year-over-year growth of search revenue. Paid clicks growth has decelerated slightly in recent quarters, but we do not immediately surmise that to be due to search declines, as algorithm and targeting changes can have a negative impact on clicks but positive impact on
conversions and thus revenue for Google. Furthermore, management have reiterated on several calls now that AI Overviews monetise at approximately the same rate as traditional search. If parity with two decades of traditional search revenue optimisation can be achieved within a year of starting to monetise AI Overviews, we believe AI Overviews (and AI Mode) likely has substantial monetisation upside ahead.
Source: Bristlemoon Capital, company filings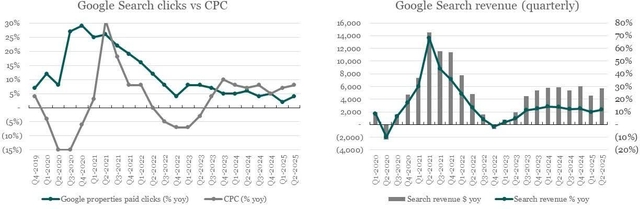
Google is also not sitting still and waiting for its search cash
flow machine to be disrupted by AI – it is fighting the Innovator’s Dilemma by disrupting itself through AI Overviews and AI Mode. By now, every Google Search user should have experienced AI Overviews considering it is available in over 200 countries and territories. AI Mode takes experience further by transforming Search into a multi-turn conversation instead of the single-query Overview.
Both AI Overview and AI Mode provide not only additional surface area to display ads, they fundamentally change the mechanics of search advertising. Traditional search advertising is based on keywords – advertisers bid on keywords they believe to be relevant to their products or services. Multi-turn AI search generates clearer intent signals and facilitates contextual targeting – showing ads relevant not just to specific keywords, but also to the context of the conversation. And if we consider the logged-in usage of most Google services, that context could extend well beyond the active conversation to, for example, recent YouTube viewing activity or Gemini chat history.
One perhaps underappreciated capability that this enables is what we’d term a platform/advertiser “push” ad model rather than a user “pull” model. Meta is the best example of a platform push model where ads are passively served to users based on what Meta thinks will interest the user. Google Search, on the other hand, is a user pull model where ads are served based explicitly on what the user is actively searching for. We believe the former provides greater incrementality and helps advertisers find customers that otherwise wouldn’t find them, while the latter is more like a tax on traffic that could otherwise still reach the advertiser organically. As AI Mode shifts Search towards intent- and context-driven advertising, we expect to see an increase in conversion rates that more than offset any declines in paid clicks as Google’s models get smarter about when and what ads to show.
Lastly on this matter, it was our belief that the perception of AI search disruption was the key development prior to the Search antitrust remedy trial that would preclude the DOJ’s most draconian proposed remedies from being awarded – that is, the forced divestment of Chrome and Android, and prohibiting Google from paying for any distribution agreements. The forced divestment of Chrome in particular would most likely have resulted in the transfer of a search distribution monopoly from one mega tech company to another, with little change to the competitive landscape.
Isn’t this all going to cost a fortune in capex?
We distinctly recall, in a prior life, trying to estimate how much it would cost Google if all 10 billion daily search queries were converted into AI-generated search results. While the details of that mid-2023 analysis escape us (it would not have bankrupted the company), the key lesson we learned remains: with model, algorithmic and hardware improvements, the cost to serve tokens can collapse by orders of magnitude over time, rendering such point-in-time cost analyses rather futile. Google, in particular, has a distinct advantage over other hyperscalers and frontier AI labs – it has a mature AI ASIC program in the TPU, which has been running for 13 years and is in its 7th generation.
This means Google has a distinct cost of compute advantage over its AI competitors. The performance specs of Google’s TPU v7 Ironwood and Nvidia’s GB200 are not dissimilar, although Nvidia has shipped around a year earlier. In any case, Ironwood appears slightly better than the GB200 on TFLOPS/watt (4.7 vs 4.2) and while we don’t know the pricing for Ironwood, we believe prior generations of TPU have been ballpark half the cost of Nvidia’s GPUs. If this relative price delta persists, Google’s TPU should continue providing the lowest total cost of ownership (TCO) per GPU/hour and the lowest TCO/GPU/watt for Google’s internal workloads. Considering Google processed 980 trillion monthly tokens in July up from 480 trillion in May, this cost advantage can quickly add up to very significant sums.
Ultimately, Google is in the enviable position of having state-of-the-art AI capabilities, best-in-class AI hardware for its internal workloads, and the operating cash flow to fund its ambitious AI infrastructure buildout. OpenAI may have won the emergent consumer AI market with ChatGPT, but Google has the opportunity to push industry token economics to zero with its lowest TCO compute and drive incremental monetisation through its unmatched advertising capabilities and scale.
Source: Bristlemoon Capital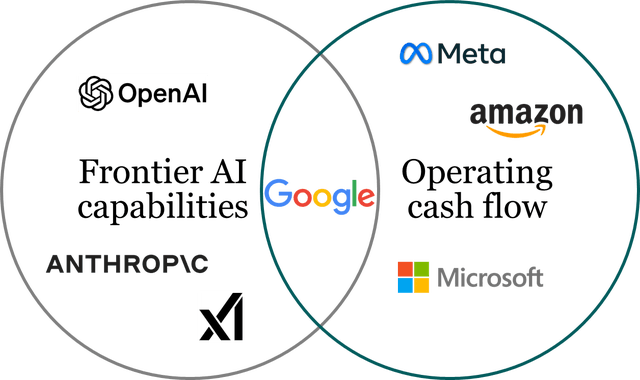
Synopsys Inc
Synopsys is the leading vendor of electronic design automation (EDA) software tools used for integrated circuit design, and the #2 licensor of chip design IP. EDA tools are mission critical for anyone who wants to design chips – from Nvidia and Analog Devices to Apple and Alibaba. The EDA market is a stable oligopoly between market leaders Synopsys and Cadence Design Systems, with Siemens (formerly Mentor Graphics) a distant third place.
As a “picks and shovels” vendor of chip design tools and IP, Synopsys benefits from an increasing number of design starts especially at the leading edge (note our comment above regarding record TSMC N2 tape-outs), and is a second-order beneficiary of all the hyperscalers pursuing custom ASICs to reduce their dependence on Nvidia GPUs.
We have followed Synopsys for several years but never found the valuation to be compelling enough for the earnings growth on offer. However, an opportunity arose following the company’s FQ3 2025 results when the stock collapsed -36% because of a miss and guide-down in the IP segment. The IP segment is c.30% of total revenue and has historically generated lower operating margins than the core EDA segment due to the high fixed cost of R&D to design the IP. The IP weakness was attributed to the temporary US EDA export restrictions placed on China in late May and subsequently lifted in early July, plus ongoing challenges at Intel’s foundry business which Synopsys supports via IP for Intel 18A (Intel is a common source of headaches for its suppliers…).
While the six-week export restriction only temporarily disrupted design starts in China, it has had a longer-lasting impact on customer decision-making. Considering the cost to design and tape out a leading edge chip design, Chinese customers have been left questioning whether continuing to work with Synopsys is worth the risk of future export controls. Synopsys has more exposure to China compared to Cadence and Siemens, and that revenue mix is heavily weighted to IP which has high operating (de)leverage. We think that this disruption is more likely temporal than structural – notwithstanding the risk of further export controls, the China domestic EDA market lacks both the full-flow tools and comprehensive IP portfolio that Synopsys offers.
The weakness associated with Intel stemmed from Synopsys’s significant R&D investments to support the Intel 18A process with IP, and the latter subsequently failing to secure any external customers for 18A. The impact is twofold – not only is there a direct earnings headwind due to the expected revenues not materialising, but there is also the opportunity cost that Synopsys incurred by allocating scarce R&D resources to Intel rather than other IP opportunities. On the earnings call, management indicated that the IP organisation is now pivoting towards opportunities within data centre AI and greater IP support for other foundries. We see this Intel-related headwind also as temporal rather than structural – not because we think Intel will successfully commercialise 18A (or even 14A for that matter) with external customers, but because the customised AI-related IP opportunity that Synopsys is pivoting towards should be more valuable than standard off-the-shelf IP.
We estimate that the above two headwinds impact FY25 and FY26 earnings by mid-teens percentage points, compared to the -36% stock price reaction. So, it appeared to us that the market significantly overreacted to the IP segment downgrade and offered a compelling and fleeting (for now) opportunity to buy a defensive, mission-critical and AI-disruption-insulated software business with a wide margin of safety.
PAR Technology Corporation – Recent Stumbles
PAR Technology Corporation (PAR) has been a stock in the portfolio since the Fund’s inception. More recently, however, PAR has experienced a significant drawdown. The stock fell 44% in a span of two months, declining from $71 per share in late July to around $40 at the end of September. That precipitous decline has been damaging to the Fund’s returns, given that PAR was a top-five portfolio position. It is worth recounting what happened and why we still believe the future is bright for PAR.
PAR reported a Q2 2025 earnings result that disappointed investors, sending the stock down by 19% in the following trading session. The culprit was PAR abandoning its prior guidance of 20% organic annual recurring revenue (ARR) growth for FY25, instead guiding investors to “mid-teens” growth. There are two factors that explain this growth reset:
- A softer restaurant spending backdrop led customers who have already signed deals with PAR to delay their point-of-sale (POS) rollouts.
- PAR itself intentionally paused certain POS installations.
Impact from softer macroenvironment
Before the Q2 2025 result, PAR’s management team had consistently communicated that PAR was insulated from macroeconomic pressures, even signalling on the Q1 2025 call that the tougher macro backdrop would push restaurant concepts to upgrade their tech stack.
This appeared reasonable to us given the following points:
- PAR comprises a miniscule portion of a restaurant’s cost base;
- Restaurants chains are relatively durable businesses and unlikely to experience a level of financial downside that would force them to shelve their technology investment plans;
- A number of PAR’s value-oriented fast-casual restaurant customers benefit from trade-down activity in a more difficult economic climate; and
- PAR has shifted their go-to-market motion to focus on communicating the ROI of PAR’s software suite, helping customers drive revenue during tougher economic periods.
It surprised us, as well as the market, when PAR CEO Savneet Singh called out macroeconomic pressures on the Q2 2025 earnings call as a reason for customers delaying the rollout of contracted deals, as well as deal signings of larger deals being delayed. Savneet reiterated that these contracted deals have been pushed out by a month or two, but have not been lost. Regardless, this growth blip contributed to greater uncertainty around PAR’s growth trajectory going forward, which no doubt fed into the steep price decline.
In September 2025, at the Morgan Stanley Laguna Industrials Conference, Savneet commented that Q2 was an unexpectedly weak quarter with two-thirds of PAR’s customers experiencing negative same store sales and negative traffic, a phenomenon the company has not witnessed outside of the COVID period. However, and somewhat reassuringly, Savneet also mentioned that while it took a few months for the restaurant industry to return to some form of normalcy following Q2, he believes that the industry has moved beyond that weak period.
Pausing rollouts to go after mega deals
As for the paused rollouts that contributed to the ARR growth downgrade, there are two parts. The first is the pause of the Burger King (BK) POS rollout, which was well-telegraphed before the Q2 2025 result. PAR re-sequenced its rollout after BK opted to add an additional PAR module. We view this as a positive sign that speaks to PAR’s “better together” value proposition – that is, customers derive greater value from using multiple products on PAR’s unified platform. The BK rollout has resumed and the feedback we’ve heard suggests that the rollout is proceeding well.
PAR also paused some TASK POS deployments in the quarter, which was a surprise and meant that the incremental ARR dollars from those deals would be pushed into later quarters. This had the effect of depressing the organic ARR growth rate for FY25. The reason for this pause was to focus on requests-for-proposal (RFPs) from several mega tier 1 quick-service restaurant (QSR) brands (two of them are global top-10 brands and the third is a top-20 brand).
In other words, Savneet made a decision to sacrifice short-term performance for long-term value creation. While the optics of a short-term ARR growth air pocket are negative, we applaud Savneet for having the courage and discipline to prioritise these transformative contracts that could unlock far greater long-term value.
One of these RFPs is widely believed to be McDonald’s, and it would potentially be for a global contract across McDonald’s more than 44,000 units. This deal alone could represent more than $100 million of incremental ARR at 50% incremental margins. And this compares to PAR’s current circa $280 million in ARR. In other words, winning McDonald’s would be a transformational deal for PAR’s business.
That magnitude of ARR would be rolled out over a multi-year period, providing good coverage and visibility of PAR’s ARR growth for years to come. Winning McDonald’s, particularly as the QSR giant has been the posterchild for a homegrown POS solution, would also be a powerful stamp of approval for PAR’s platform. No doubt other restaurant brands would seriously consider PAR’s solution if it was good enough for McDonald’s to abandon its own inhouse POS software.
Handicapping the odds of winning McDonald’s or any number of the three mega tier-1 deals is very difficult. However, if each deal has a 30% chance of success, the odds of winning at least one of the three deals is around 66%. At a 50% chance of success per deal, the odds of winning at least one of the deals rises to approximately 88%. We believe there are decent odds that PAR manages to close at least one of the three mega deals. Any of these mega deals would be additive to an organic ARR growth trajectory that we believe should return to 20% and beyond in early 2026.
Despite the potential to win one or multiple of these mega tier-1 RFPs, PAR’s stock has continued to drift lower following the post-result sell-off. We think there’s now a materially higher chance that a private equity outfit is running the rule over PAR as an acquisition target. Notably, private equity giant Thoma Bravo acquired PAR’s competitor, Olo, earlier this year, outbidding who we suspect was PAR for that asset. It would make strategic sense to combine these assets, and we believe that Thoma Bravo has been given an opportunistic window to launch a takeover of PAR – that is, PAR is trading cheaply and any announcement of a mega tier-1 deal by PAR would likely foreclose the opportunity for Thoma Bravo to pick up this asset on the cheap.
PAR has been an example of some of the volatility that can occur when investing in a good business that is in the process of becoming a great business. PAR is a complex story with financials that are messy due to a major divestiture, acquisitions, and periodic heavy investments. It takes a bit of digging and analysis to build conviction in the story for PAR. The problem is if others don’t do the deep work to understand the story, then they are less likely to stay the course when doubt is cast over the growth potential. The complexity makes it harder for others to see the value.
While we believe the underlying economics associated with incremental ARR dollars are very attractive, the company is not yet free cash flow positive and current profitability is muted. There was a reliance on continued execution to prove out the financial potential of PAR. Things were previously heading in the right direction and our thesis was playing out, but the Q2 result prompted investors to second guess what sort of financial performance the company is capable of achieving.
We think at the current price level, there is an enormous upside asymmetry, particularly in the event that PAR wins McDonald’s or another mega tier-1 restaurant brand. We are comfortable bearing some of this near-term volatility to remain exposed to this upside.
Once again, it is an honour to be entrusted with the responsibility of managing your capital. We hope that the transparency we strive for in our communications, both via these quarterly missives and the Bristlemoon newsletter, give you confidence that we approach every investment decision with analytical rigour and care. We work tirelessly to build investing insights and conviction so that we can make sensible investment decisions with the goal of helping the Fund compound at attractive rates for many years to come.
Kind regards,
Bristlemoon Capital
|
Disclaimer This report has been prepared by Bristlemoon Capital Pty Ltd (AFSL: 552045), the Trustee of the Bristlemoon Global Fund, to provide you with general information only. It does not take into account the investment objectives nor financial situation of any particular person. Bristlemoon Research Pty Ltd (CAR No: 1309157) is the Investment Manager of the Fund. You should obtain a copy of the Investment Memorandum before making a decision about whether to invest in this product. While information in this document has been prepared with all reasonable care, Bristlemoon does not make any representation or warranty as to the accuracy or completeness of any statement in this document, including forecasts. To the extent permitted by law, neither Bristlemoon nor its employees or representatives are liable for any loss or damage arising as a result of reliance placed on the contents of this document. Fund performance is calculated after fees and costs, including the investment management fee and performance fee. All returns are on a pre-tax basis. Past performance should not be taken as an indicator of future performance. Applications to invest in the Bristlemoon Global Fund are only considered from wholesale investors. |
Original Post
Editor’s Note: The summary bullets for this article were chosen by Seeking Alpha editors.
Editor’s Note: This article discusses one or more securities that do not trade on a major U.S. exchange. Please be aware of the risks associated with these stocks.